
Every campaign. Every number. No theater.
We track revenue lifted, cost-per-acquisition, and ROAS — not impressions. Below is the ledger.

The numbers behind the decisions
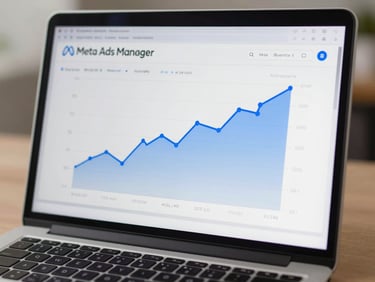
4.8× ROAS in 60 days
CPA cut by 41% in one quarter
$210K revenue in 30 days
Rebuilt audience segmentation and shifted budget to bottom-funnel retargeting. Revenue per ad dollar rose from 1.9× to 4.8× without increasing total spend.
Replaced broad-awareness video with decision-stage content mapped to job title. LinkedIn demo requests rose 73% while cost-per-qualified-lead dropped 41%.
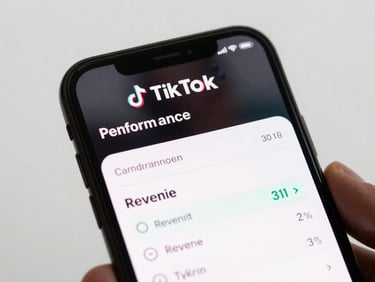
Platform-native short-form tied directly to a product page with one-tap checkout. Conversion rate on ad traffic hit 6.3% — three times the category average.
3.9× avg ROAS
38% lower CPA
$4.2M revenue tracked
Median return on ad spend across all managed accounts over the last 12 months.
Average cost-per-acquisition reduction after the first strategy revision cycle, measured at 90 days.
Total attributed revenue across client campaigns in 2024, tracked to last-click and modeled assist.
Your campaign. Your numbers. Let's build the math.
Bring your current CPA and target ROAS. We'll map out where the revenue gap is and how direct-response social closes it.